15 Years. 87 Presentations. Here Is What U.S. Healthcare Actually Looks Like in 2026.
April 23, 2026
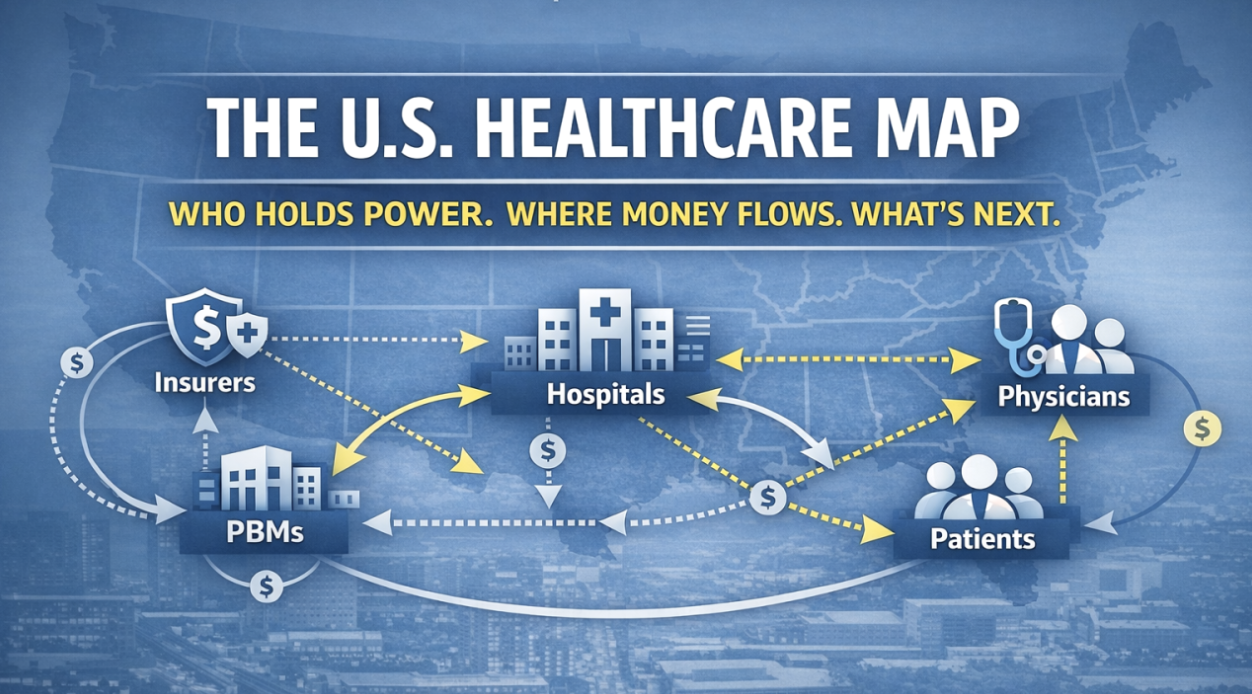
You do not need another 80-page market report.
You need a clean map: who the actors are, how money and power flow, and where the system is actually moving.
That is why I started what became HealthcareData.center.
I originally built this work while serving as a Distinguished Service Professor at Carnegie Mellon University’s Heinz College, as a shared reference point for my students and the faculty committees I served on. I will be honest: the faculty and students at Heinz College made me smarter than I had any right to be. I never asked the university to fund this work. That was never the point. What you get from a room full of genuinely curious people asking hard questions is worth more than any grant. The financial commitment has always been mine. The inspiration came from them.
I also owe a particular debt of gratitude to Jacqueline Speedy, Associate Dean of Heinz College of Information Systems and Public Policy, whose continued support of this work has meant more than I can adequately express here.
Over time, something interesting happened. Startup founders, healthcare IT leaders, and industry executives began using the same materials to orient their own teams. The resource evolved from a teaching aid into a practical data source for people building companies, products, and strategies.
Today, HealthcareData.center is the public face of that effort. I have been updating these briefings for more than 15 years, keeping the structure consistent while refreshing the underlying data and policy context. The focus is deliberately U.S.-centric: the structures, economics, and policy environment that shape how care is delivered and paid for in America.
For 2026, I just finished a full refresh of several core reports. When you read them side by side, a consistent picture of U.S. healthcare emerges. This post is the high-level readout. All of the updated presentations are now live at healthcaredata.center.
What HealthcareData.center Is Trying To Do
The premise is simple. Most leaders only see their slice of the system.
- The team managing drug benefits at a large Pharmacy Benefit Manager (PBM) is operating in a fundamentally different economic reality than the federally qualified community health clinic trying to serve the same patient.
- A hospital supply-chain executive optimizing procurement costs is rarely fluent in how Medicaid waiver policy shapes what their safety-net partners can afford.
- A digital health founder building for primary care often discovers too late how hospital Group Purchasing Organization (GPO) contracts quietly determine whether their product ever reaches the physician.
In the classroom at Carnegie Mellon, I saw the same blind spots in future leaders: brilliant in their domain, but missing the rest of the chessboard. HealthcareData.center is my attempt to knit those pieces together. It is a set of concise, data-driven overviews of each major structure in the U.S. system, written so that students, faculty, operators, and investors can drop into a new domain and get oriented quickly.
HealthcareData.center now contains 87 presentations covering the full U.S. healthcare ecosystem. Keeping that library current is not a weekend project. It is a deliberate, ongoing commitment I have maintained for fifteen years.
This resource has always been independent, non-commercial, and non-partisan. No institution, sponsor, or funder has ever shaped what goes in or what gets emphasized. That is a deliberate choice rooted in the same values that drove the original academic work: the obligation is to get it right, not to get it funded.
To bring practitioner voices alongside the data, I launched the Chalk Talk Jim podcast, where healthcare operators, founders, and executives talk through the real-world dynamics behind these structures. The presentations give you the map. The podcast gives you the people navigating it. You can find it at chalktalkjim.com.
Every year I revise a dozen or more of these briefings with fresh data and policy developments. In the latest update, I refreshed:
- Long-Term Care (LTC)
- U.S. Physician Offices
- Federally Qualified Health Centers (FQHCs)
- Patient-Centered Medical Homes (PCMHs)
- Accountable Care Organizations (ACOs)
- Group Purchasing Organizations (GPOs) and Integrated Delivery Networks (IDNs)
- Pharmacy Benefit Managers (PBMs)
Taken together, they tell you as much about the system as they do about each individual market.
What the Data Actually Shows
The U.S. healthcare system looks broken from the outside. Costs are unsustainable. Outcomes lag peer nations. Patients feel like afterthoughts in a system that was supposed to center them.
But broken implies it stopped working. It has not stopped working. It is working exactly as its incentive structure was designed to work. Costs concentrate where the incentives are richest. Delivery frays where the margins are thinnest. Volume gets rewarded. Prevention gets underpaid.
None of this is an accident. It is a design problem. Specifically, it is two problems operating together.
The first is structural lag. The system was built around the economics of acute, episodic, high-margin care: infectious disease, trauma, surgical repair. Those incentives made sense for their era. But the disease burden has shifted. Chronic disease is now the dominant challenge. Prevention, coordination, and longitudinal care are where the real leverage lives. The incentive structure has not caught up.
The second is deliberate opacity. Much of that outdated structure is protected by complexity that resists being understood. Pharmacy benefit manager contracts are confidential by design. Hospital group purchasing agreements are shielded. Hospital rates were hidden until regulators forced disclosure. Reimbursement coding is impenetrable to most of the people who depend on it. Every sub-component of this system has pockets of hidden information, and in many cases that opacity is protected precisely because transparency would threaten the margin.
The opacity is not abstract. It is the thing that kills companies after the Series A. A digital health founder discovers too late that a formulary decision made in a room they were never in has made their product economically invisible to the prescribing physician. A startup builds two years of product around a reimbursement pathway and cannot get a straight answer on coding until after launch. The complexity is not accidental. In many cases it is the product.
And in 2026, the evidence of both forces is simply too consistent to ignore.
HealthcareData.center exists to pull those curtains back. Not to assign blame. Not to advocate for a particular reform agenda. But to make the structure visible, because you cannot redesign what you cannot see. That is why this resource has never had a sponsor. That is why it has never been monetized or politicized.
A map shaped by a funder is not a map. It is a sales tool.
Fifteen years of independence is the only way this kind of transparency is possible.
A nation cannot sustain competitive advantage if its health system is consuming the human capital that advantage depends on.
The five themes below are not a checklist. They are five exhibits for the same verdict.
1. High Spend, Fragile Front Lines
The money is big. The margins at the front line are thin.
Across long-term care, physician offices, and the safety net, you see the same pattern.
1. Costs are rising faster than general inflation.
Costs are rising faster than general inflation.
Long-term care facilities and physician offices are absorbing high single-digit cost increases while their fee schedules lag. Post-pandemic wage, rent, and technology pressures are compounding the squeeze.
The people doing the most essential work are being squeezed hardest.
2. The work that prevents downstream cost is structurally underpaid.
Primary care, behavioral health, and care coordination are where downstream utilization is actually influenced.
Yet most of the durable margin in the system still sits in procedures, acute inpatient care, and specialty drugs.
The system pays generously for what happens after things go wrong and underinvests in what would prevent it.
3. Patients experience the gap as affordability and access problems.
Even with record national health spending, many patients cannot access or afford the care they need.
Long waits, narrow access in rural and low-income areas, and cost-sharing that bites at the point of care are not edge cases.
Recent survey data show large shares of adults actively delaying care due to cost. High spend does not mean broad access.
2. Consolidation and Intermediaries With Leverage
Almost every updated report shows the same structural move: fewer, bigger intermediaries.
1. Pharmacy Benefit Managers and Group Purchasing Organizations have concentrated to a degree that would have been unthinkable twenty years ago.
A small group of PBMs now manages drug benefits for the majority of insured Americans.
Three to four GPOs control a large share of hospital purchasing volume and beds.
The levers of the system are in very few hands.
2. Physician independence is largely a historical artifact.
Only about 47 percent of physicians now work in practices with ten or fewer physicians.
That is down from over 60 percent in 2012. Hospital employment, corporate platforms, and private-equity backed groups have absorbed the rest.
The traditional independent practice is becoming the exception, not the rule.
3. Financial risk is pooling at the top of the system.
In Medicare and commercial risk products, financial responsibility is concentrating inside larger Accountable Care Organizations (ACOs), health systems, and organizations that control both care delivery and payment flows simultaneously.
When those nodes are misaligned, the ripple travels fast and far.
Scale can fund infrastructure and analytics. It can also insulate bad incentives from market pressure.
Consolidation is not automatically bad. The problem is simple: when economic and clinical power concentrate in a few nodes, misaligned incentives ripple faster and farther. Recent antitrust and Federal Trade Commission (FTC) activity around PBMs, Integrated Delivery Networks (IDNs), and physician practice acquisitions reflects that tension.
3. Workforce Is the Binding Constraint
We talk about cost and quality. Underneath, we are talking about the workforce.
1. The workforce is burning out.
Surveys show roughly 40 to 50 percent of physicians reporting burnout symptoms.
Long-term care aides and home-health workers face low wages and chronically high turnover. Federally Qualified Health Centers (FQHCs) and rural practices run vacancy lists they cannot fill.
A system that cannot retain its workforce cannot deliver on any promise it makes to patients.
2. Geography is destiny for too many patients.
Over 90 percent of rural U.S. counties are formally designated primary-care shortage areas.
In 2023, primary care supply in rural areas met only 69 percent of estimated demand.
Some counties have no primary care physicians at all. That is not a gap. That is an absence.
3. Advanced models depend on stable teams.
Patient-Centered Medical Homes (PCMHs), ACOs, risk-based contracts, and care-management programs all assume multidisciplinary teams that can do outreach, follow-up, and coordination consistently over time.
When staffing is thin, these models collapse back into reactive visit-based care very quickly.
The slide deck may say advanced primary care. The calendar may still say 15-minute visits plus an overloaded inbox.
If you are planning a new product, program, or partnership in 2026, assume that workforce capacity and working conditions are more determinative than the contractual model on paper.
4. Advanced Primary Care Has Become the Default Chassis
The language of reform has converged. The implementation quality has not.
Across the PCMH, ACO, FQHC, and physician-office reports, you see the same operating blueprint emerge.
- Defined patient panels and attribution.
- Risk stratification and patient registries.
- Care management for high-need patients.
- Behavioral health integration.
- Digital access and hybrid visits.
- Equity-focused measurement and performance stratification.
Ten years ago, this was pilot language. Today, it is the default way serious payers and health systems talk about primary care. Two important realities sit underneath that.
1. Recognition is not capability.
Recognition is not capability.
Organizations can hold PCMH plaques and participate in ACOs while still running visit-only, poorly coordinated practices.
Labels are cheap. Operating maturity is not.
2. The evidence is meaningful but mixed.
When these capabilities are fully built and supported, the results are real.
Better chronic disease metrics, improved patient experience, and lower emergency-department use are all documented in mature implementations.
When they are partial, underfunded, or treated as check-the-box documentation exercises, results look like noise.
If you are buying, selling, or building around advanced primary care, you need to ask one hard question. Are you looking at a mature operating model, or a marketing slide.
5. Transparency and Accountability Are Slowly Tightening
The black boxes are a little less black each year.
Policy and enforcement moves over the last few cycles are pushing toward more visibility into the flows and incentives that have historically been shielded.
1. PBM and GPO disclosure.
New reporting requirements and Federal Trade Commission work are forcing more visibility into drug pricing flows.
Rebate arrangements, spread pricing, and administrative fees that were previously opaque are now subjects of formal investigation and published findings.
The flows that were invisible are becoming visible.
2. 340B drug pricing and GPO prohibition enforcement.
The 340B program, which provides discounted drugs to safety-net providers, is under closer scrutiny.
How 340B discounts, GPO contracts, and split billing interact in multi-hospital systems is receiving renewed regulatory attention.
Organizations that relied on complexity as a shield are finding that shield thinner than it was.
3. Price transparency and benchmark debates.
Hospital and health-plan price-transparency rules are unevenly implemented but already changing negotiations.
Benchmark and risk-adjustment rules in ACO and Medicare Advantage programs are under active revision.
The era of negotiating in the dark is ending. Slowly and unevenly, but it is ending.
4. Equity-linked performance metrics.
ACO models and PCMH frameworks increasingly tie payments to equity-stratified performance.
Health-equity planning is moving from aspiration to measurement, with financial consequences attached.
Average performance is no longer enough. The distribution matters.
None of this is a clean overhaul. It is incremental, messy, and technical. For you, the signal is clear. Whatever role you play in the system, you will be asked to justify value with more granular, auditable data than you were five years ago.
Bottom Line: How To Use This Work
If you have read this far, you probably live inside one of these domains.
- You run a service line, clinic, or health-system function.
- You build or invest in digital health, medical technology, or analytics offerings.
- You advise boards and policy teams that need a grounded view of the ecosystem.
Here is how I would use these updated reports.
1. Orient fast.
Use each briefing as a 30 to 60 minute onboarding to a domain you do not live in every day: PBMs, GPOs, IDNs, FQHCs, ACOs, LTC, PCMHs, physician offices.
2. Map dependencies.
Ask where your product or strategy intersects with the structural trends in that domain: consolidation, workforce, payment, regulation, and equity.
3. Pressure-test assumptions.
If your plan assumes ample primary-care capacity, flexible independent practices, or frictionless contracting with large intermediaries, compare that assumption to the realities described in the reports.
4. Watch the slow variables.
Payment models change by rulemaking. Workforce, consolidation, and trust change over years. The reports focus on those slow variables so you can plan beyond the next rate-update cycle.
Every person who reads this and understands the system a little more clearly is a small vote for a different kind of healthcare. Not a broken one. Not a perfect one. A more visible one.
That is what this work is for.
Start with the presentations. Stay for the podcast. Reach out when you are ready to talk.
All the updated 2026 presentations are at healthcaredata.center. For the practitioner conversations behind the data, subscribe to the Chalk Talk Jim podcast at chalktalkjim.com. And when you are ready to talk through what any of this means for your market, reach out directly at jim@jfjordan.com.